OpenACC: Analysis
Steps in porting code to GPUs
The three key steps in porting to high performance accelerated code:
Analyze/Identify parallelism
Express data movement and parallelism
Optimize data movement and loop performance
Go back to 1!
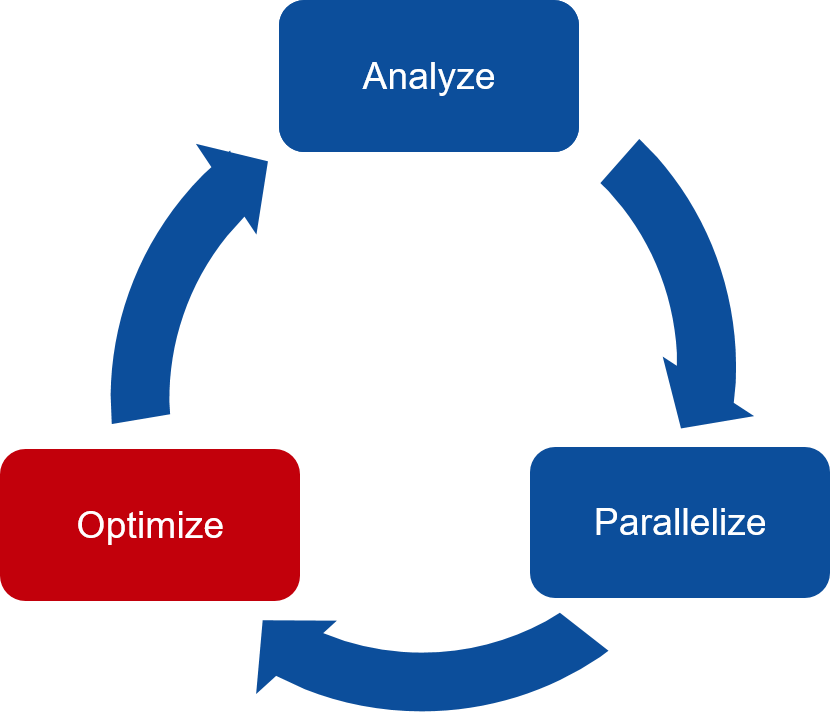
Analyze your code to determine most likely places needing parallelization or optimization.
Parallelize your code by starting with the most time consuming parts and check for correctness.
Optimize your code to improve observed speed-up from parallelization.
One should generally start the process at the top with the analyze step. For complex applications, it’s useful to have a profiling tool available to learn where your application is spending its execution time and to focus your efforts there. Since our example code is quite a bit simpler than a full application, we’ll skip profiling the code and simply analyze the code by reading it
Compiler diagnostics
Compiler diagnostics is usually the first thing to check when starting the OpenACC work
It can tell you what operations were actually performed
Data copies that were made
If and how the loops were parallelized
The diagnostics is very compiler dependent
Compiler flags
Level and formatting of information
Diagnostics is controlled by compiler flag
-Minfo=optionUseful options:
accel– operations related to the acceleratorall– print all compiler outputintensity– print loop computational intensity info
Work sharing construct: loop
- Define a loop to be parallelized
C/C++:
#pragma acc loop [clauses]Fortran:
!$acc loop [clauses]Must be followed by a C/C++ or Fortran loop construct.
- Combined constructs with
parallelandkernels #pragma acc kernels loop / !$acc kernels loop#pragma acc parallel loop / !$acc parallel loop
- Combined constructs with
Similar in functionality to OpenMP
for/doconstructLoop index variables are
privatevariables by default
Example: Adding two vectors
Adding two vectors
#include <stdio.h>
#ifdef _OPENACC
#include <openacc.h>
#endif

#define NX 102400

int main(void)
{
    double vecA[NX], vecB[NX], vecC[NX];
    double sum;
    int i;

    /* Initialization of the vectors */
    for (i = 0; i < NX; i++) {
        vecA[i] = 1.0 / ((double) (NX - i));
        vecB[i] = vecA[i] * vecA[i];
    }

    /* TODO:
     * Implement vector addition on device with OpenACC
     * vecC = vecA + vecB
     */
    for (i = 0; i < NX; i++) {
       vecC[i] = vecA[i] + vecB[i];
    }

    sum = 0.0;
    /* Compute the check value */
    for (i = 0; i < NX; i++) {
        sum += vecC[i];
    }
    printf("Reduction sum: %18.16f\n", sum);

    return 0;
}
#include <stdio.h>
#ifdef _OPENACC
#include <openacc.h>
#endif

#define NX 102400

int main(void)
{
    double vecA[NX], vecB[NX], vecC[NX];
    double sum;
    int i;

    /* Initialization of the vectors */
    for (i = 0; i < NX; i++) {
        vecA[i] = 1.0 / ((double) (NX - i));
        vecB[i] = vecA[i] * vecA[i];
    }

#pragma acc data copy(vecA,vecB,vecC)
{
#pragma acc parallel
    {
#pragma acc loop
        for (i = 0; i < NX; i++) {
            vecC[i] = vecA[i] * vecB[i];
        }
    }
}
    sum = 0.0;
    /* Compute the check value */
    for (i = 0; i < NX; i++) {
        sum += vecC[i];
    }
    printf("Reduction sum: %18.16f\n", sum);

    return 0;
}
#include <stdio.h>
#ifdef _OPENACC
#include <openacc.h>
#endif

#define NX 102400

int main(void)
{
    double vecA[NX], vecB[NX], vecC[NX];
    double sum;
    int i;

    /* Initialization of the vectors */
    for (i = 0; i < NX; i++) {
        vecA[i] = 1.0 / ((double) (NX - i));
        vecB[i] = vecA[i] * vecA[i];
    }

#pragma acc data copy(vecA,vecB,vecC)
{
#pragma acc kernels
    for (i = 0; i < NX; i++) {
        vecC[i] = vecA[i] + vecB[i];
    }
}
    sum = 0.0;
    /* Compute the check value */
    for (i = 0; i < NX; i++) {
        sum += vecC[i];
    }
    printf("Reduction sum: %18.16f\n", sum);

    return 0;
}
-Minfo
$ pgcc -g -O3 -acc -Minfo=acc sum_parallel.c -o sum

main:
   21, Generating copy(vecA[:],vecB[:],vecC[:]) [if not already present]
   23, Generating Tesla code
       25, #pragma acc loop gang, vector(128) /* blockIdx.x threadIdx.x */

$ pgcc -g -O3 -acc -Minfo=accel sum_kernels.c -o sum

main:
   21, Generating copy(vecA[:],vecB[:],vecC[:]) [if not already present]
   23, Loop is parallelizable
       Generating Tesla code
       23, #pragma acc loop gang, vector(128) /* blockIdx.x threadIdx.x */
Example: PGI_ACC_TIME=1
 $ cat slurm-13186502.out  #output of sum_parallel.c

 Accelerator Kernel Timing data
 main  NVIDIA  devicenum=0
   time(us): 451
   21: data region reached 2 times
       21: data copyin transfers: 3
            device time(us): total=245 max=100 min=71 avg=81
       29: data copyout transfers: 3
            device time(us): total=206 max=72 min=67 avg=68
   23: compute region reached 1 time
       23: kernel launched 1 time
           grid: [800]  block: [128]
           elapsed time(us): total=41 max=41 min=41 avg=41
  Reduction sum: 1.2020569031119108

$ cat slurm-13186514.out

Accelerator Kernel Timing data
 main  NVIDIA  devicenum=0
   time(us): 453
   21: data region reached 2 times
       21: data copyin transfers: 3
            device time(us): total=247 max=100 min=72 avg=82
       26: data copyout transfers: 3
            device time(us): total=206 max=73 min=66 avg=68
   23: compute region reached 1 time
       23: kernel launched 1 time
           grid: [800]  block: [128]
           elapsed time(us): total=40 max=40 min=40 avg=40
Reduction sum: 1.2020569031119108
NVIDIA nvprof
NVIDIA nvprof provides a simple interface to collect on a target without using the GUI. (new NSight system)
GPU profiling capabilities: High-level usage statistics, Timeline collection, Analysis metrics
basic CPU sampling
The Himeno stencil benchmark
Solving Poisson’s equation for incompressible fluid by the Jacobi iteration method.
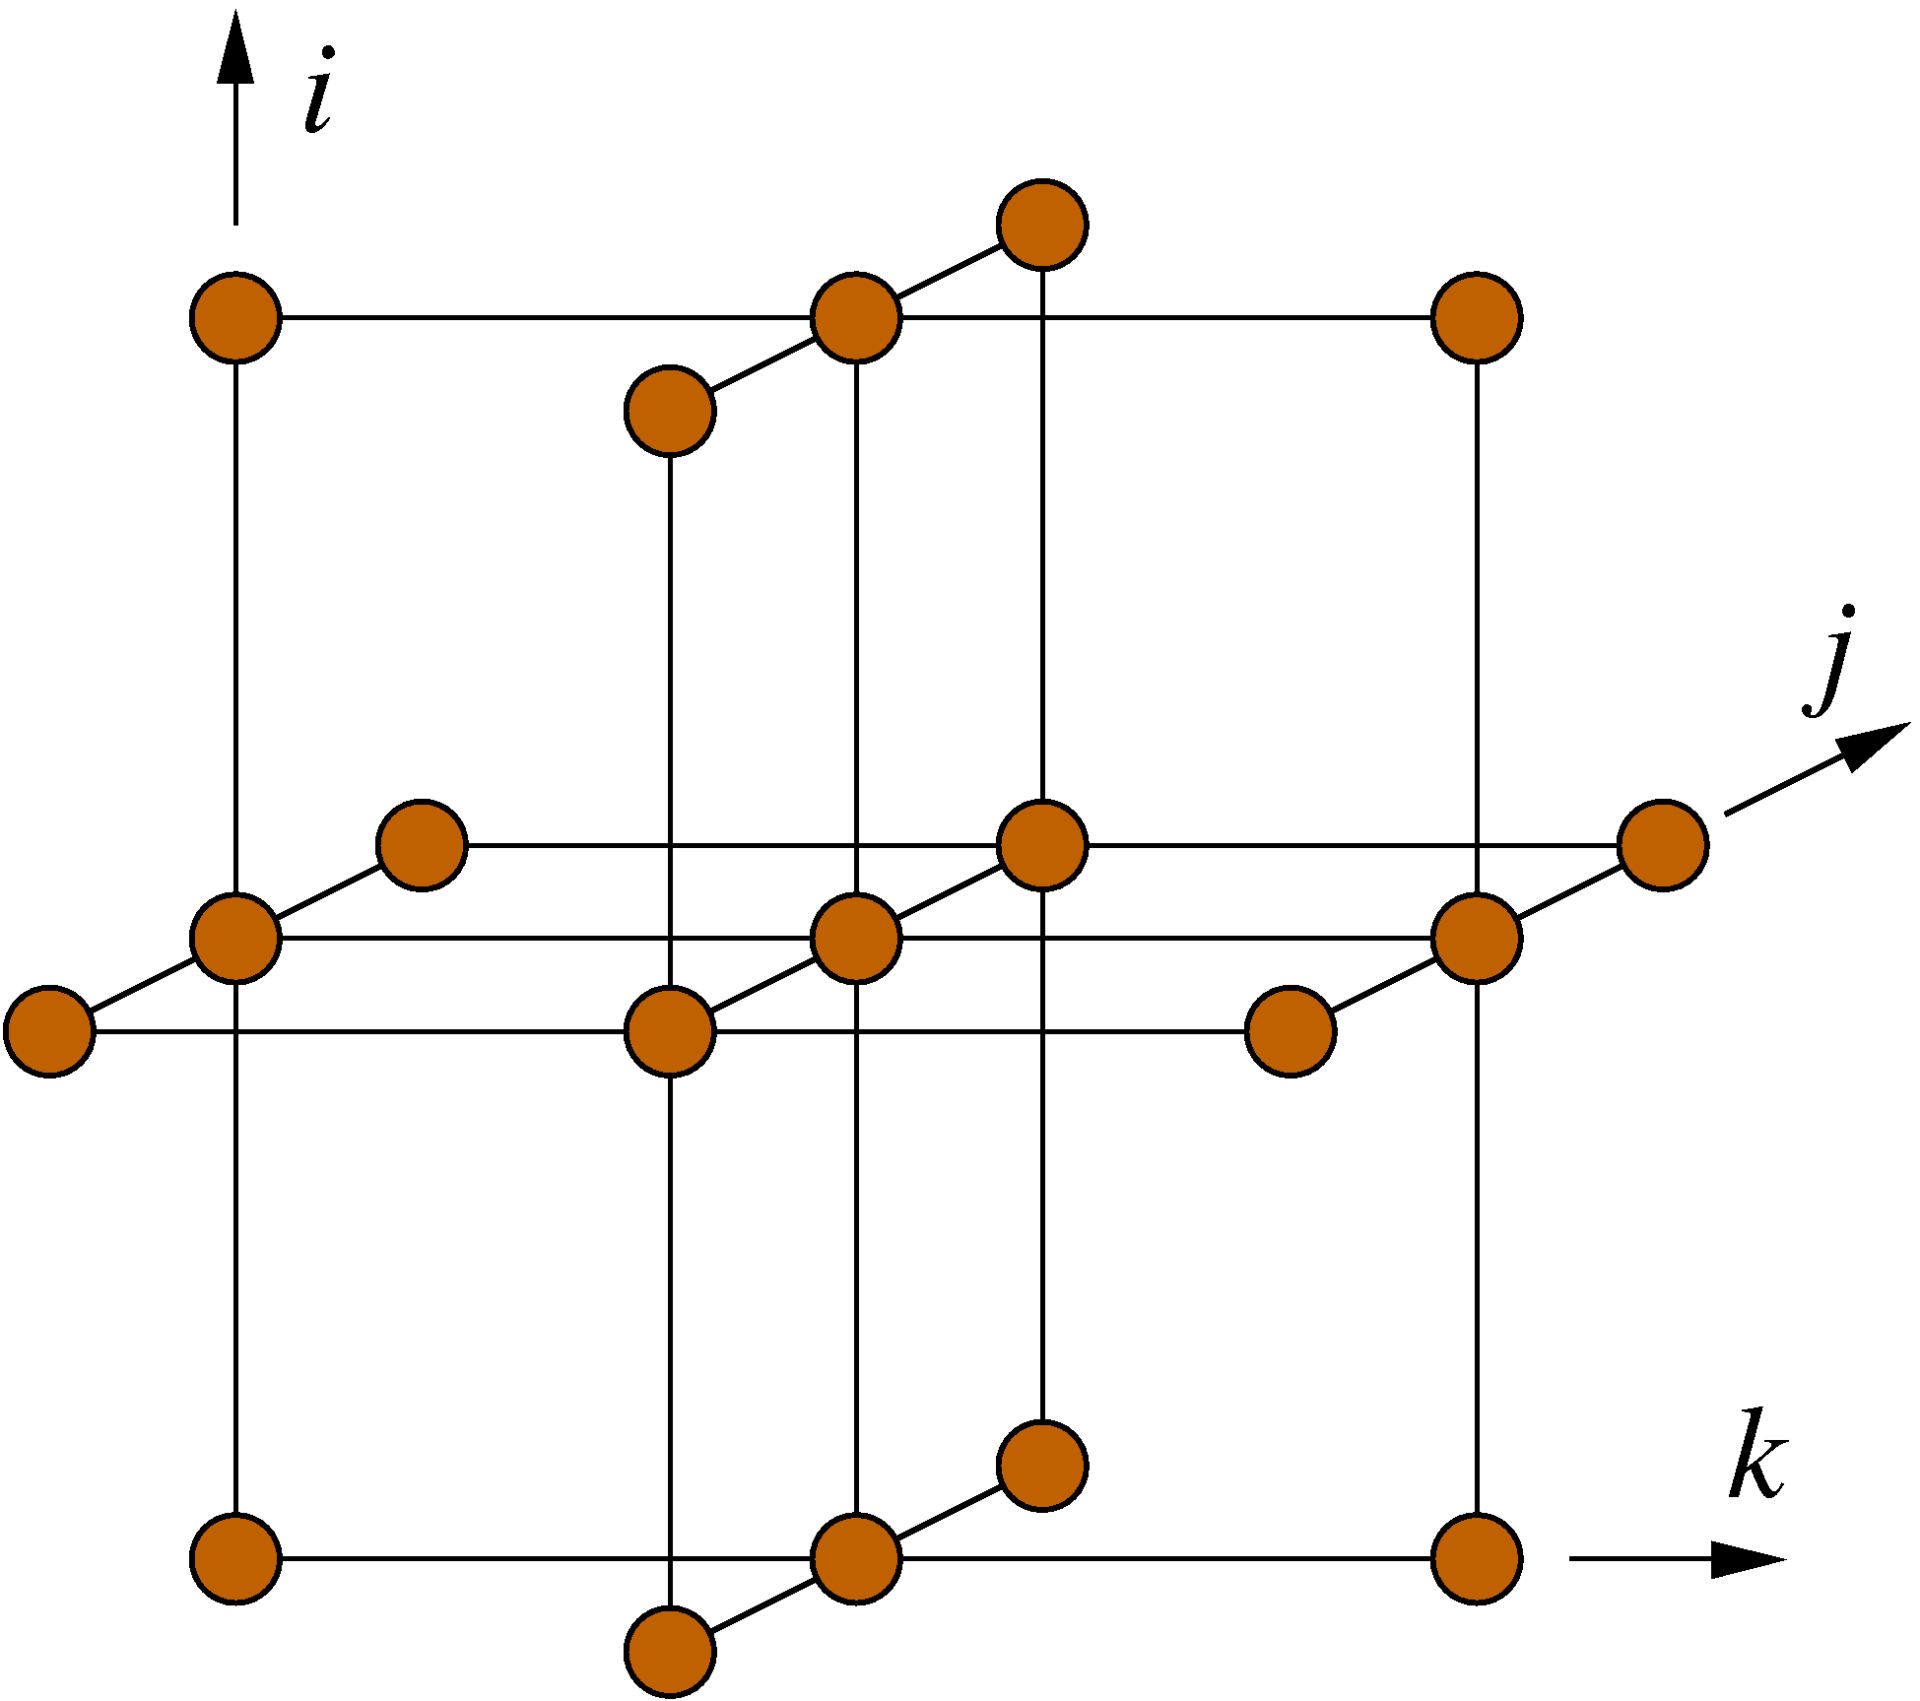
(https://blogs.fau.de/hager/archives/7850)
himeno code
/*********************************************************************
      This benchmark test program is measuring a cpu performance
      of floating point operation and memory access speed.

      Modification needed for testing turget computer!!
      Please adjust parameter : nn to take one minute to execute
      all calculation.  Original parameter set is for PC with
      200 MHz MMX PENTIUM, whose score using this benchmark test
      is about 32.3 MFLOPS.

      If you have any question, please ask me via email.
      written by Ryutaro HIMENO, October 3, 1998.
      Version 2.0
      ----------------------------------------------
         Ryutaro Himeno, Dr. of Eng.
         Head of Computer Information Center,
         The Institute of Pysical and Chemical Research (RIKEN)
         Email : himeno@postman.riken.go.jp
      ---------------------------------------------------------------
      You can adjust the size of this benchmark code to fit your target
      computer.  In that case, please chose following sets of
      (mimax,mjmax,mkmax):
       small : 129,65,65
       midium: 257,129,129
       large : 513,257,257
       ext.large: 1025,513,513
      This program is to measure a computer performance in MFLOPS
      by using a kernel which appears in a linear solver of pressure
      Poisson included in an incompressible Navier-Stokes solver.
      A point-Jacobi method is employed in this solver.
      ------------------
      Finite-difference method, curvilinear coodinate system
      Vectorizable and parallelizable on each grid point
      No. of grid points : imax x jmax x kmax including boundaries
      ------------------
      A,B,C:coefficient matrix, wrk1: source term of Poisson equation
      wrk2 : working area, OMEGA : relaxation parameter
      BND:control variable for boundaries and objects ( = 0 or 1)
      P: pressure
       -----------------
      -------------------
      "use portlib" statement on the next line is for Visual fortran
      to use UNIX libraries.  Please remove it if your system is UNIX.
      -------------------
     use portlib

     Version 0.2
*********************************************************************/

#include <stdio.h>

#include "himeno_C.h"

#ifdef SMALL
#define MIMAX            129
#define MJMAX            65
#define MKMAX            65
#endif

#ifdef MIDDLE
#define MIMAX            257
#define MJMAX            129
#define MKMAX            129
#endif

#ifdef LARGE
#define MIMAX            513
#define MJMAX            257
#define MKMAX            257
#endif

#ifdef DOUBLE_PRECISION
typedef double real;
#else
typedef float real;
#endif

static real  p[MIMAX][MJMAX][MKMAX];
static real  a[MIMAX][MJMAX][MKMAX][4],
              b[MIMAX][MJMAX][MKMAX][3],
              c[MIMAX][MJMAX][MKMAX][3];
static real  bnd[MIMAX][MJMAX][MKMAX];
static real  wrk1[MIMAX][MJMAX][MKMAX],
              wrk2[MIMAX][MJMAX][MKMAX];

#define NN               3

double second();
real jacobi(int);
void initmt();

static int imax, jmax, kmax;
static real omega;

int
main()
{
  int i, j, k;
  real gosa;
  double cpu0, cpu1, nflop, xmflops2, score;

  omega = 0.8;
  imax = MIMAX-1;
  jmax = MJMAX-1;
  kmax = MKMAX-1;

  /*
   *    Initializing matrixes
   */
  initmt();

  printf("mimax = %d mjmax = %d mkmax = %d\n",MIMAX, MJMAX, MKMAX);
  printf("imax = %d jmax = %d kmax =%d\n",imax,jmax,kmax);

  /*
   *    Start measuring
   */
  cpu0 = second();

  /*
   *    Jacobi iteration
   */

  gosa = jacobi(NN);

  cpu1 = second();
  cpu1 = cpu1 - cpu0;

  nflop = (kmax-2)*(jmax-2)*(imax-2)*34;

  if(cpu1 != 0.0)
    xmflops2 = nflop/cpu1*1.0e-6*(real)NN;

  score = xmflops2/32.27;

  printf("\ncpu : %f sec.\n", cpu1);
  printf("Loop executed for %d times\n",NN);
  printf("Gosa : %e \n",gosa);
  printf("MFLOPS measured : %f\n",xmflops2);
  printf("Score based on MMX Pentium 200MHz : %f\n",score);

  // Now estimate how many iterations could be done in 20s
  int nn2 = 20.0/cpu1*NN;
  cpu0 = second();
  gosa = jacobi(nn2);
  cpu1 = second();
  cpu1 = cpu1 - cpu0;

  nflop = (kmax-2)*(jmax-2)*(imax-2)*34;

  if(cpu1 != 0.0)
    xmflops2 = nflop/cpu1*1.0e-6*(real)nn2;

  score = xmflops2/32.27;

  printf("\ncpu : %f sec.\n", cpu1);
  printf("Loop executed for %d times\n",nn2);
  printf("Gosa : %e \n",gosa);
  printf("MFLOPS measured : %f\n",xmflops2);
  printf("Score based on MMX Pentium 200MHz : %f\n",score);

  return (0);
}

void initmt()
{
  int i,j,k;

  // TODO: Implement data initialization with OpenACC on device

  // TODO: Implement computation with OpenACC on device
  for(i=0 ; i<imax ; ++i)
    for(j=0 ; j<jmax ; ++j)
      for(k=0 ; k<kmax ; ++k){
        a[i][j][k][0]=0.0;
        a[i][j][k][1]=0.0;
        a[i][j][k][2]=0.0;
        a[i][j][k][3]=0.0;
        b[i][j][k][0]=0.0;
        b[i][j][k][1]=0.0;
        b[i][j][k][2]=0.0;
        c[i][j][k][0]=0.0;
        c[i][j][k][1]=0.0;
        c[i][j][k][2]=0.0;
        p[i][j][k]=0.0;
        wrk1[i][j][k]=0.0;
        bnd[i][j][k]=0.0;
      }

  // TODO: Implement computation with OpenACC on device
  for(i=0 ; i<imax ; ++i)
    for(j=0 ; j<jmax ; ++j)
      for(k=0 ; k<kmax ; ++k){
        a[i][j][k][0]=1.0;
        a[i][j][k][1]=1.0;
        a[i][j][k][2]=1.0;
        a[i][j][k][3]=1.0/6.0;
        b[i][j][k][0]=0.0;
        b[i][j][k][1]=0.0;
        b[i][j][k][2]=0.0;
        c[i][j][k][0]=1.0;
        c[i][j][k][1]=1.0;
        c[i][j][k][2]=1.0;
        p[i][j][k]=(real)(k*k)/(real)((kmax-1)*(kmax-1));
        wrk1[i][j][k]=0.0;
        bnd[i][j][k]=1.0;
      }
}

real jacobi(int nn)
{
  int i,j,k,n;
  real gosa, s0, ss;

  // TODO: Implement data initialization with OpenACC on device
  for(n=0;n<nn;++n){
    gosa = 0.0;

    // TODO: Implement computation with OpenACC on device
    for(i=1 ; i<imax-1 ; ++i)
      for(j=1 ; j<jmax-1 ; ++j)
        for(k=1 ; k<kmax-1 ; ++k){
          s0 = a[i][j][k][0] * p[i+1][j  ][k  ]
             + a[i][j][k][1] * p[i  ][j+1][k  ]
             + a[i][j][k][2] * p[i  ][j  ][k+1]
             + b[i][j][k][0] * ( p[i+1][j+1][k  ] - p[i+1][j-1][k  ]
                               - p[i-1][j+1][k  ] + p[i-1][j-1][k  ] )
             + b[i][j][k][1] * ( p[i  ][j+1][k+1] - p[i  ][j-1][k+1]
                               - p[i  ][j+1][k-1] + p[i  ][j-1][k-1] )
             + b[i][j][k][2] * ( p[i+1][j  ][k+1] - p[i-1][j  ][k+1]
                               - p[i+1][j  ][k-1] + p[i-1][j  ][k-1] )
             + c[i][j][k][0] * p[i-1][j  ][k  ]
             + c[i][j][k][1] * p[i  ][j-1][k  ]
             + c[i][j][k][2] * p[i  ][j  ][k-1]
             + wrk1[i][j][k];

          ss = ( s0 * a[i][j][k][3] - p[i][j][k] ) * bnd[i][j][k];

	  gosa = gosa + ss*ss;

          wrk2[i][j][k] = p[i][j][k] + omega * ss;
        }
    printf("nn %d, gosa %f\n",n,gosa);

    // TODO: Implement computation with OpenACC on device
    for(i=1 ; i<imax-1 ; ++i)
      for(j=1 ; j<jmax-1 ; ++j)
        for(k=1 ; k<kmax-1 ; ++k)
          p[i][j][k] = wrk2[i][j][k];
  } /* end n loop */

  return(gosa);
}

double second()
{
#include <sys/time.h>

  struct timeval tm;
  double t ;

  static int base_sec = 0,base_usec = 0;

  gettimeofday(&tm, NULL);

  if(base_sec == 0 && base_usec == 0)
    {
      base_sec = tm.tv_sec;
      base_usec = tm.tv_usec;
      t = 0.0;
  } else {
    t = (double) (tm.tv_sec-base_sec) +
      ((double) (tm.tv_usec-base_usec))/1.0e6 ;
  }

  return t ;
}
$ srun -n 1 nvprof --cpu-profiling on --cpu-profiling-mode top-down ./himeno.x
======== CPU profiling result (top down):
Time(%)      Time  Name
85.74%    18.16s  jacobi
 7.46%     1.58s  initmt
 0.94%     200ms  | ???
 6.75%     1.43s  __c_mcopy4_sky
 0.05%      10ms  __c_mcopy4
Summary
Profiling is essential for optimization
NVPROF and NVVP for NVIDIA platform