Getting to Know Your Data
Every day, we come across large amounts of data in many different types and formats. Data may appear as numbers and categories in spreadsheets, time-series measurements from sensors, text in documents, events and logs generated by applications, or multimedia such as images, audio, and video. Understanding how to effectively organize, process, and prepare these diverse forms of data is essential for meaningful analysis, reliable decision-making, and successful machine learning and data science projects. Before we can analyze or model data, we first need to understand what kind of data we have, where it comes from, how it is represented, and how it is stored.
In this episode, we will provide a general overview of big data, data types, data formats, data storage, and data wrangling. We will explore the different forms of data that data practitioners commonly encounter, discuss structured, semi-structured, and unstructured data, and introduce common formats and storage approaches. We will then introduce data wrangling and examine why cleaning, transforming, integrating, and validating data are important steps in turning raw data into analysis-ready data.
Objectives
Describe the concept of big data and explain its key characteristics and challenges.
Identify and distinguish common types of data, including numerical, categorical, time-series, text, event/log, image, audio, video, graph, and multimodal data.
Recognize common data formats, sources, and storage approaches used to represent and manage different types of data.
Explain what data wrangling is and why it is important for transforming raw data into clean, reliable, and analysis-ready data.
Instructor note
20 minutes teaching
10 minutes discussion
1. Big Data
Discussion
How large is the data you are working with?
Are you experiencing performance bottlenecks when you try to analyse it?
Every day, we encounter countless events that generate data – an e-commerce transaction, a hospital record, a sensor reading, a LinkedIn/X post, or a customer interaction. At the same time, modern organizations continuously produce enormous amounts of data from websites, mobile applications, business systems, IoT devices, social media, and other digital platforms. As these individual data-generating activities occur at an ever-increasing scale, speed, and variety, the challenge is no longer simply about having data, but about managing and making sense of massive and diverse datasets. This growing phenomenon is what we commonly refer to as Big Data.
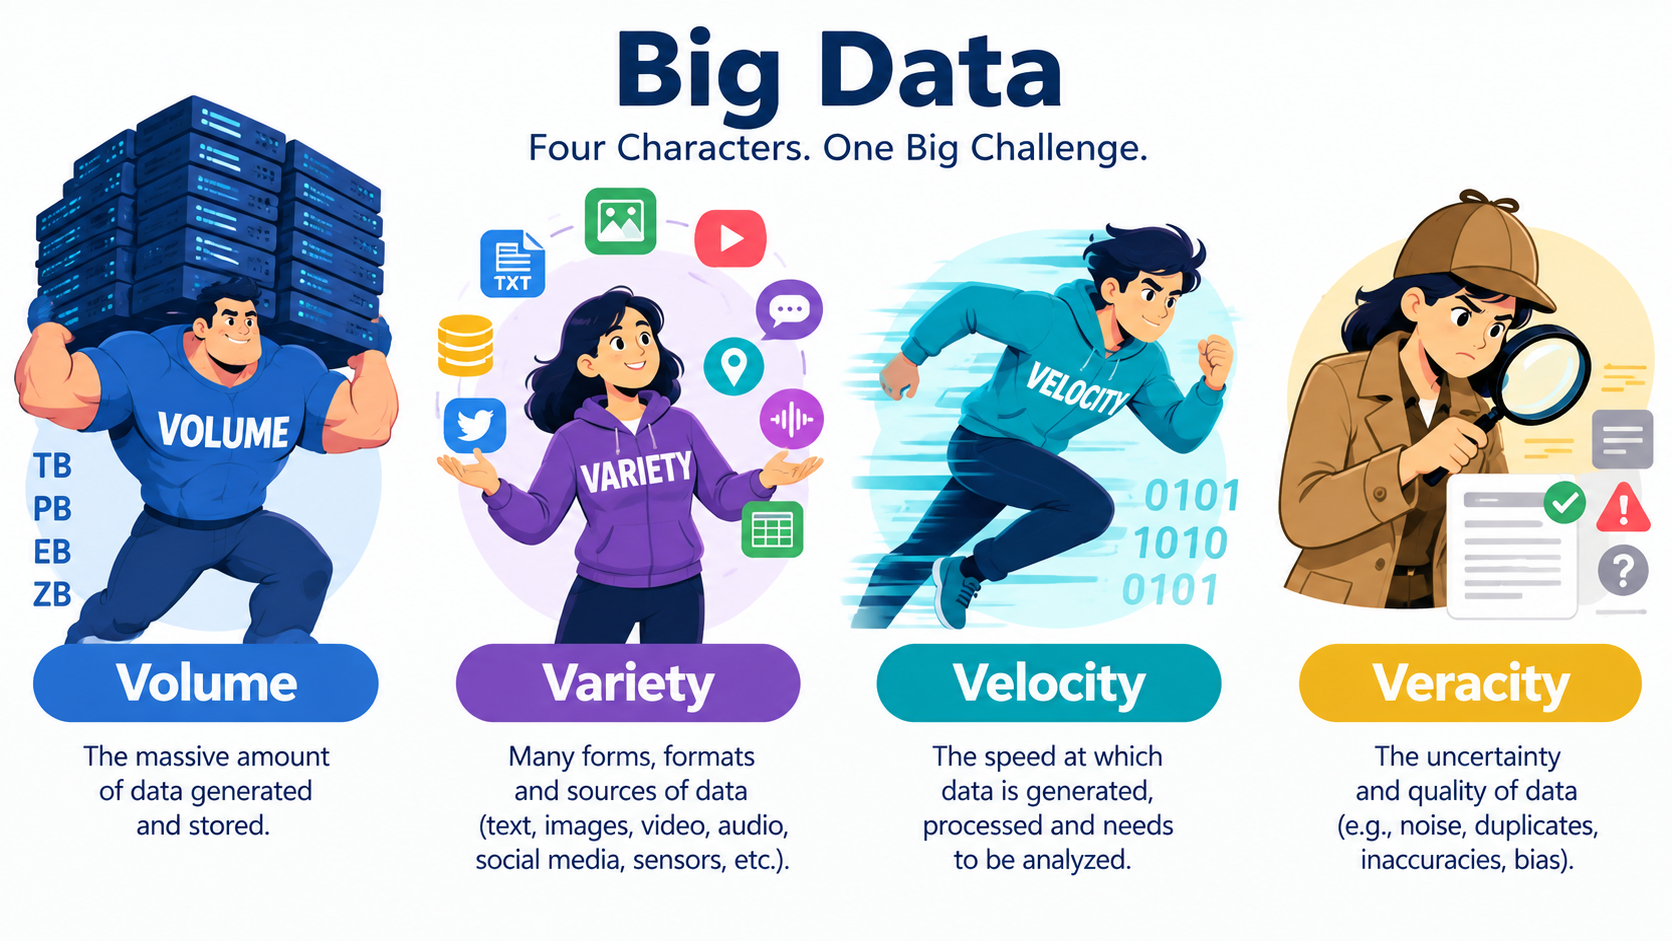
Big Data is commonly described through the Four Vs, which highlight the main characteristics that make Big Data different from traditional datasets:
Volume refers to the enormous amount of data generated and stored every day. Modern organizations can produce data at a scale ranging from gigabytes and terabytes to petabytes and beyond.
Variety refers to the wide range of forms and formats in which data is generated. Data can be structured, such as tables and transaction records; semi-structured, such as JSON and XML; or unstructured, such as text, images, audio, video, and social media content.
Velocity refers to the speed at which data is generated, collected, transmitted, and processed. Many modern systems continuously produce data in real time, such as IoT sensors, GPS signals, financial transactions, and social media activity.
Veracity refers to the quality, accuracy, reliability, and trustworthiness of data. Because Big Data is collected from many different sources, it may contain missing values, duplicates, noise, errors, inconsistencies, or biased information. Ensuring data veracity is therefore essential for producing reliable analysis and meaningful insights.
from IPython.display import display, Image
display(Image("../images/fundamental-data/big-data-4vs.png", width=1024))
Because of issues with data veracity, Big Data is often raw, noisy, and unreliable, meaning that it is rarely ready for analysis when we first receive it. Therefore, before Big Data can be transformed into meaningful insights, it must first be collected, cleaned, integrated, transformed, and prepared to ensure that it is accurate, consistent, reliable, and suitable for analysis.
2. Data Type, Format, and Storage
As data is generated, observed, measured, and collected from a wide range of sources, it can appear in many different forms. For example, a customer record may contain a name, age, and purchase amount; a sensor may produce temperature readings over time; a social media platform may collect text, images, and videos; and a healthcare system may store patient records and medical measurements. When we talk about data, two key concepts are data type and data format. Although these terms are closely related, they describe different aspects of data and should not be used interchangeably.
2.1 Data type
A data type describes the kind of value or information that the data represents and determines how that value can be interpreted and processed. Common data types include numeric, categorical, textual, Boolean, date/time, and spatial data.
display(Image("../images/fundamental-data/all-data-types.png", width=1024))
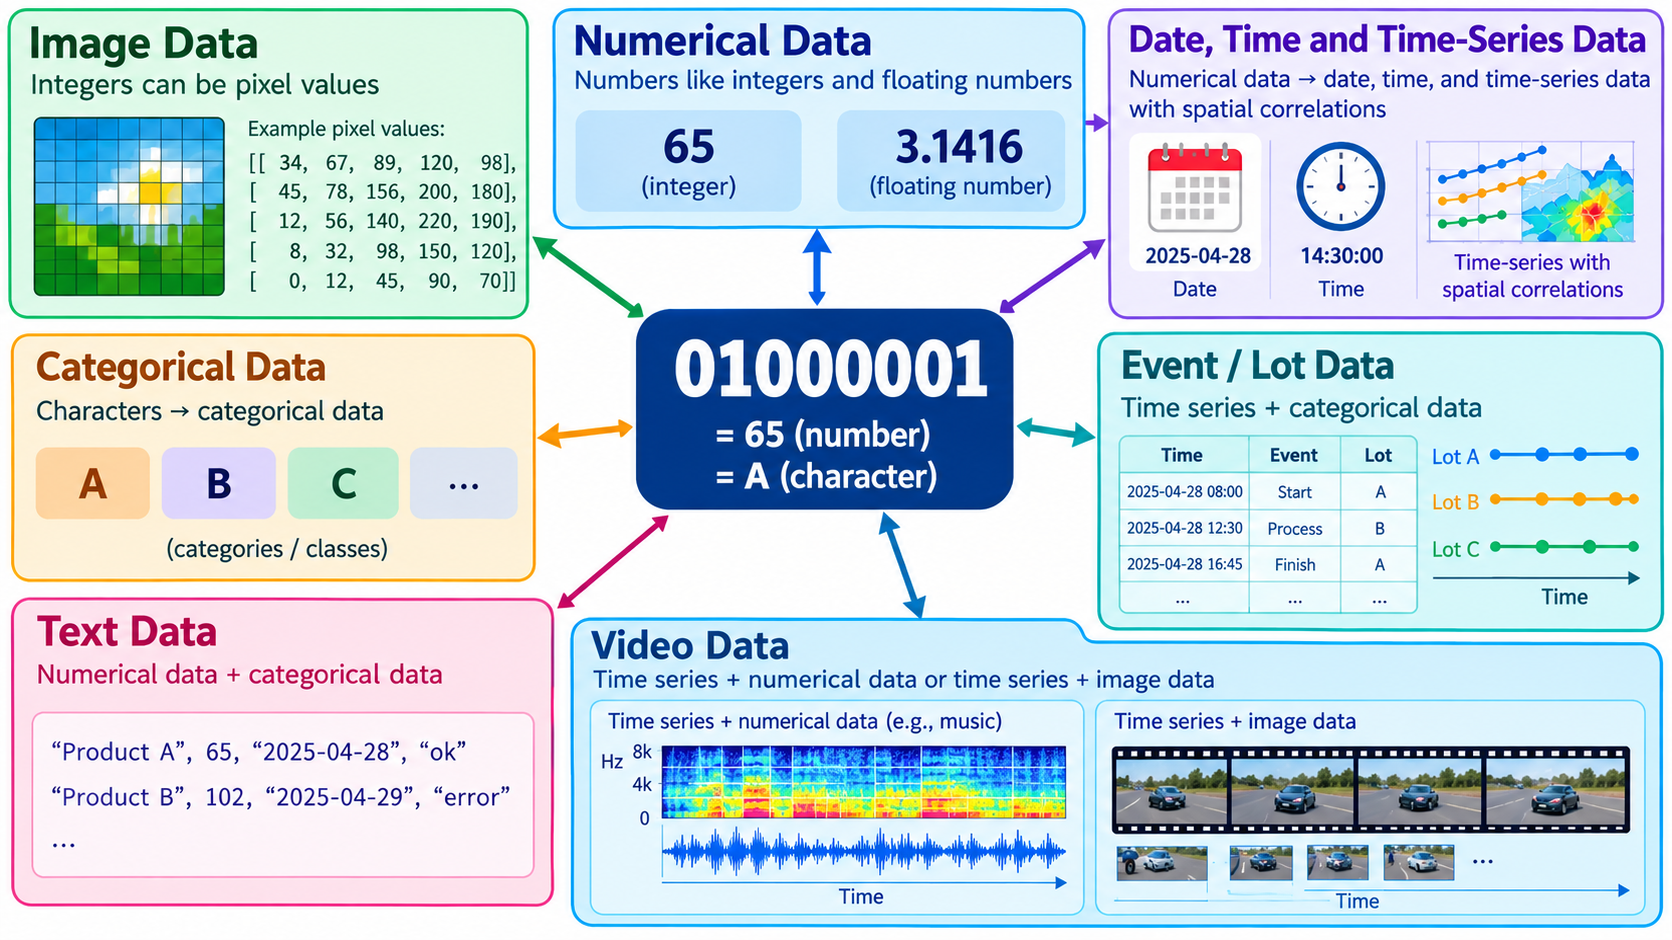
Even though we have many different data types, at the most fundamental level, all data stored and processed by a computer is ultimately represented as bits and bytes. The smallest unit of digital information is a bit, which can have only two possible values: 0 or 1. Typically, eight bits are grouped together to form a byte. A single byte contains 8 bits and can represent up to 256 distinct values (from 0 to 255).
For example, consider the 8-bit binary sequence 01000001 stored in a computer. If we interpret this bit pattern as an unsigned integer, it represents the number 65. However, if we interpret the same bit pattern using the ASCII character encoding, it represents the character A. This illustrates an important idea: bits themselves do not inherently tell us whether the data represents a number, a character, or something else, and the interpretation depends on how the bits are encoded and how the computer is instructed to read them.
In the same way, a sequence of bytes stored in a computer can be interpreted as numbers or characters, depending on the encoding and data format being used. From these fundamental representations, we can construct and interpret many other data types. For example, numbers can be used to represent measurements, quantities, or numerical values, while characters and text can be combined to represent words, sentences, and other textual information. More complex data types, such as categorical data, Boolean values, dates and times, and time series, can also ultimately be represented using combinations of numbers and characters.
Therefore, at the computer level, numbers and characters (or text) form fundamental building blocks for representing data. Higher-level data types are created by assigning meaning and structure to these basic representations. In other words, although we work with many different data types at the application or analytical level, they are ultimately encoded and stored as patterns of bits and bytes at the computer level.
In our daily lives, we often come across another important concept when working with data: metadata. Metadata is essentially “data about data” – it is information that describes the characteristics, structure, meaning, source, or context of a piece of data. For example, when we take a photo, the image itself is the data, while information such as the date and time it was taken, the location, camera model, image dimensions, and file size can be considered metadata. Metadata is different from a data type, which describes what kind of value the data represents, such as a number, text, Boolean value, or date/time. In simple terms, data type tells us what the data is, while metadata provides additional information that helps us understand, describe, and manage the data.
2.2 Data format
By organizing bits and bytes in different ways and interpreting them according to specific rules or encoding schemes, computers can represent, store, and process a wide variety of data formats. A data format describes how data is structured, organized, represented, and stored so that it can be understood and processed by computers and software systems. Common examples include CSV, JSON, XML, Parquet, and Excel files for structured or semi-structured data, as well as image, audio, and video formats for multimedia data.
Different data formats and structures are suited to different types of data and analytical tasks:
Tabular data organizes information into rows and columns and is commonly stored in formats such as CSV and Excel. Numerical data can also be represented as arrays, including scalars (0D), vectors (1D), matrices (2D), and tensors (3D or higher), which support mathematical and computational operations.
Textual data represents information as sequences of characters, including letters, numbers, symbols, and punctuation. It can be structured, semi-structured, or unstructured. Structured or semi-structured text is commonly stored in formats such as JSON and XML, while text can also be embedded in formats such as Parquet.
Images, video, and audio represent visual and auditory information. Images are typically represented as arrays of pixels, videos as sequences of image frames over time, and audio as time-series signals. Common file formats include JPEG/PNG, MP4, and WAV/MP3, respectively.
Graphs and networks represent relationships between entities using nodes (vertices) and edges (connections). They are commonly used to model social networks, molecular interactions, transportation systems, and other complex relationships, and can be stored using formats such as GraphML, GEXF, and GML.
Note
In simple terms, data type tells us what the data means, while data format tells us how the data is represented or stored. For example, a temperature measurement may have a numeric data type, while the same measurement could be stored in CSV, JSON, or Parquet format.
Thus, data type and data format are related but distinct:
type describes the nature of the information;
format describes its representation.
2.3 Data storage
Data storage refers to how data is physically or digitally organized and maintained so that it can be accessed, processed, and preserved by a computer system. At the most fundamental level, computers store data as bits and bytes, but these bits and bytes can be organized using different storage mechanisms and formats depending on the type and purpose of the data.
For example, data may be stored in files such as CSV, JSON, Excel, or Parquet; in databases such as relational or NoSQL databases; or in specialized storage systems for images, audio, video, and graph data. Thus, data storage describes where and how data is kept, while a data storage format describes how that data is organized and encoded within the storage system.
Below is an overview of common data formats (✅ for good, 🟨 for ok/depends on a case, and ❌ for bad) adapted from Aalto university’s Python for scientific computing.
Name |
Human |
Space |
Arbitrary |
Tidy |
Array |
Long term |
|---|---|---|---|---|---|---|
CSV |
✅ |
❌ |
❌ |
✅ |
🟨 |
✅ |
Excel |
❌ |
❌ |
❌ |
🟨 |
❌ |
🟨 |
JSON |
✅ |
❌ |
🟨 |
❌ |
❌ |
✅ |
Pickle |
❌ |
🟨 |
✅ |
🟨 |
🟨 |
❌ |
npy |
❌ |
🟨 |
❌ |
❌ |
✅ |
❌ |
Feather |
❌ |
✅ |
❌ |
✅ |
❌ |
❌ |
HDF5 |
❌ |
✅ |
❌ |
❌ |
✅ |
✅ |
NetCDF4 |
❌ |
✅ |
❌ |
❌ |
✅ |
✅ |
Parquet |
❌ |
✅ |
🟨 |
✅ |
🟨 |
✅ |
Graph formats |
🟨 |
🟨 |
❌ |
❌ |
❌ |
✅ |
Callout
There isn’t one data storage format that works in all cases, so choose a file format that best suits your data. Choice of format affects storage efficiency, speed of access, compatibility with tools, and ease of use for humans.
Discussion
What types of data do you work with in your research? For example, numerical, textual, image, audio, or time-series data?
How do you use these data in your research? For example, do you use them for analysis, visualization, or publication?
Do you use your data to train large language models (LLMs), develop machine learning models, or perform other research tasks?
3. Data Wrangling
No matter how data is structured, represented, encoded, or organized, raw data is rarely ready to be used directly for analysis or to generate meaningful insights. It may contain missing values, errors, duplicates, inconsistencies, noise, or irrelevant information, especially when it is collected from multiple sources. Therefore, raw data needs to be carefully prepared to improve its quality, consistency, reliability, and usability before analysis.
Data wrangling is the process of preparing raw data for analysis by cleaning, integrating, transforming, and preprocessing it. It may involve handling missing or incorrect values, removing duplicates, combining data from different sources, converting data into appropriate formats, and restructuring datasets to meet analytical requirements. The goal of data wrangling is to transform raw, messy data into clean, consistent, and analysis-ready data so that it can support reliable analysis and meaningful insights.
The exact steps vary by project, but commonly include:
Data discovery and understanding – Inspecting the data to understand its structure, variables, data types, sources, and quality.
Data cleaning – Handling missing values, duplicates, errors, outliers, inconsistent values, and other quality problems.
Data integration – Combining data from multiple sources, such as databases, CSV files, APIs, or sensor systems, and resolving differences between them.
Data transformation – Changing data into a suitable form, such as converting data types, scaling numerical values, encoding categorical variables, or transforming variables.
Data restructuring – Rearranging the organization of data, such as merging, joining, splitting, pivoting, or reshaping tables.
Data reduction or filtering – Removing irrelevant records, variables, or unnecessary information to create a more manageable dataset.
Data validation – Checking that the resulting data is accurate, consistent, complete, and logically valid.
Data preparation – Organizing and formatting the final dataset so that it is ready for statistical analysis, visualization, machine learning, or other downstream tasks.
In the following episodes, we will explore several of these data-wrangling steps across different types of data, including numerical, categorical, time-series, text, event/log, and image data. We will see how the characteristics of each data type influence the way we inspect, clean, transform, integrate, and prepare the data for analysis. By working with these different examples, we will develop a practical understanding of how raw data can be systematically transformed into clean, consistent, reliable, and analysis-ready datasets.