Profiling SYCL applications
Questions
How can we identify performance issues in our SYCL code?
Objectives
Learn to use the profiling interface in the SYCL standard.
Explore graphical profilers.
It is rarely the case that the first version of a performance-critical code delivers satisfactory performance. Creating performant software requires awareness of the problem domain and the algorithms employed, but a good dose of empirical performance measurements are also needed to remove bottlenecks and optimize the code. Time-to-solution is an important performance metrics, but it’s not the sole metric one should care about: how well are we using the hardware at hand? Are the available cores always busy? What about memory usage? Performance profiling helps us answer these questions and guides us in identifying and fixing performance issues.
This episode will show, using the heat equation mini-app, how to obtain this kind of information when SYCL is our programming model of choice.
Profiling with SYCL events [*]
The SYCL event API can also be used to obtain timing information on various
stages of work execution on any given queue. To do so, we need to initialize our
queue object for profiling:
queue Q{ gpu_selector{}, { property::queue::enable_profiling() } };
this is achieved by passing a list containing the enable_profiling() property to the constructor.
Events submitted to the queue will now collect timestamps of work submission,
execution start, and execution stop.
Recall from episode The task graph: data, dependencies, synchronization that the submit
method on a queue object returns an object of event type. We have seen
how to use these objects to explicitly manage the task graph of our application.
With the queue initialized for profiling, we can take an event and probe the
collected timestamps.
For example, to obtain the timestamp, in nanoseconds, when the some work was
submitted to the queue one could write the following code:
auto e = Q.submit([&](handler &cgh){
   /* body */
});

// make sure the task completed
e.wait();

const auto submit =
   e.get_profiling_info<info::event_profiling::command_submit>();
The SYCL standard includes the following three queries for the
get_profiling_info method of the event class:
info::event_profiling::command_submit, timestamp in nanoseconds when the associated command group was submitted to the queue.info::event_profiling::command_start, timestamp in nanoseconds when the action associated with the command group (e.g. kernel invocation) started executing on the device.info::event_profiling::command_end, the timestamp in nanoseconds when the action associated with the command group (e.g. kernel invocation) finished executing on the device.
Profiling the SYCL heat equation mini app with events
You can find the scaffold for this exercise in the
content/code/day-2/06_sycl-heat-equation folder. Before starting, make a
copy of this folder:
cp -r 07_sycl-heat-equation event-profiling
cd event-profiling
Our goal is to modify the mini-app to:
Use a profiling-enabled SYCL queue.
Collect events and analyze the information regarding command group submission and kernel execution.
A working solution can be found in the
content/code/day-2/01_sycl-events-profiling folder.
Recall that for every time step, we submit a new command group, each with one action: the application of the stencil
Declare two
floatvariables to hold the cumulative time, in milliseconds, spent in command group submission and kernel execution:float cgSubmissionTime = 0; float kernExecutionTime = 0;
We will accumulate the data obtained from the events in these variables.
Modify the code for the
evolvefunction incore.cpp. We want to return the event corresponding to the command group submission to the queue. Be careful where you put thereturnstatement: we are opening a new scope to make sure that host-device synchronization is handled automatically!Within the time-stepping loop in the
mainfunction, wait on the event return from the stencil application. Why do we need it?Obtain the timestamps for command group submission, kernel execution start, and kernel execution stop. Compute the time spent in command group submission and kernel execution. Accumulate it in the appropriate variables.
Print out a summary. Where are we spending most of our time?
Does the total execution time of the mini-app change? By how much?
Profiling with backend tools
The use of SYCL events is not the best way to go about profiling:
The information provided might not be as fine-grained as needed to correctly identify performance bottlenecks.
The changes needed to adapt an existing code to “profiling” mode might be too substantial.
It is usual to rely on sampling profilers to obtain a more well-rounded snapshot of the performance aspects of a software. Sampling profilers accumulate statistical measures of given counters, such as memory loads/stores and register occupancy, and provide a final report to the user. They introduce execution overhead, but the wealth of information they can provide is extremely valuable.
There are many performance profiling tools available, here is an incomplete list:
Intel VTune which offers both command-line tools and a GUI to obtain and analyze performance on x86 architectures, especially suited for Intel CPUs.
AMD uprof similar to VTune, but for AMD CPUs.
NVIDIA Nsight Systems command-line tools and GUI for performance profiling of CUDA GPU code.
AMD rocprof a command-line tool for performance profiling of ROCm and HIP GPU code.
LIKWID a free, open-source set of command-line tools that works on many CPU architectures and NVIDIA GPUs.
When we tried to answer the question What is SYCL? we saw that the implementors of the standard rely on existing low-level backends for parallel code generation.

Each of the SYCL implementations can map to a number of native backends. Many of these provide a full-fledged ecosystem of programming tools, including profilers and debuggers. Any of these can be used with compiled SYCL code.
For example, the hipSYCL compiler can generate GPU code targeting the CUDA and ROCm backends and it is thus possible to use the respective profiling tools to analyze the performance of our SYCL code.
Profiling the SYCL heat equation mini app with NVIDIA Nsight Systems
Before starting, you should open a VNC session to Karolina, following the
instructions in Graphical sessions using VNC.
We will use the code in the content/code/day-2/06_sycl-heat-equation
folder unmodified.
In your VNC session, open a terminal and obtain an interactive job with:
qsub -A DD-22-28 -q qnvidia -l select=1:ngpus=1 -I
Load the hipSYCL and CMake modules. Configure and build the code as usual:
cmake -S. -Bbuild -DHIPSYCL_TARGETS="cuda:sm_80"
cmake --build build
Run a profiler collection with the command-line tool:
nsys profile ./build/heat 800 800 1000
This will produce a file with extension
qdrepwith the profiling data.Open a new terminal tab and load the hipSYCL module. Open the NVIDIA Nsight Systems GUI with:
nsys-ui
Load the
qdrepfile into the GUI: File > Open and select the file in the navigator menu. You will see a timeline similar to the following: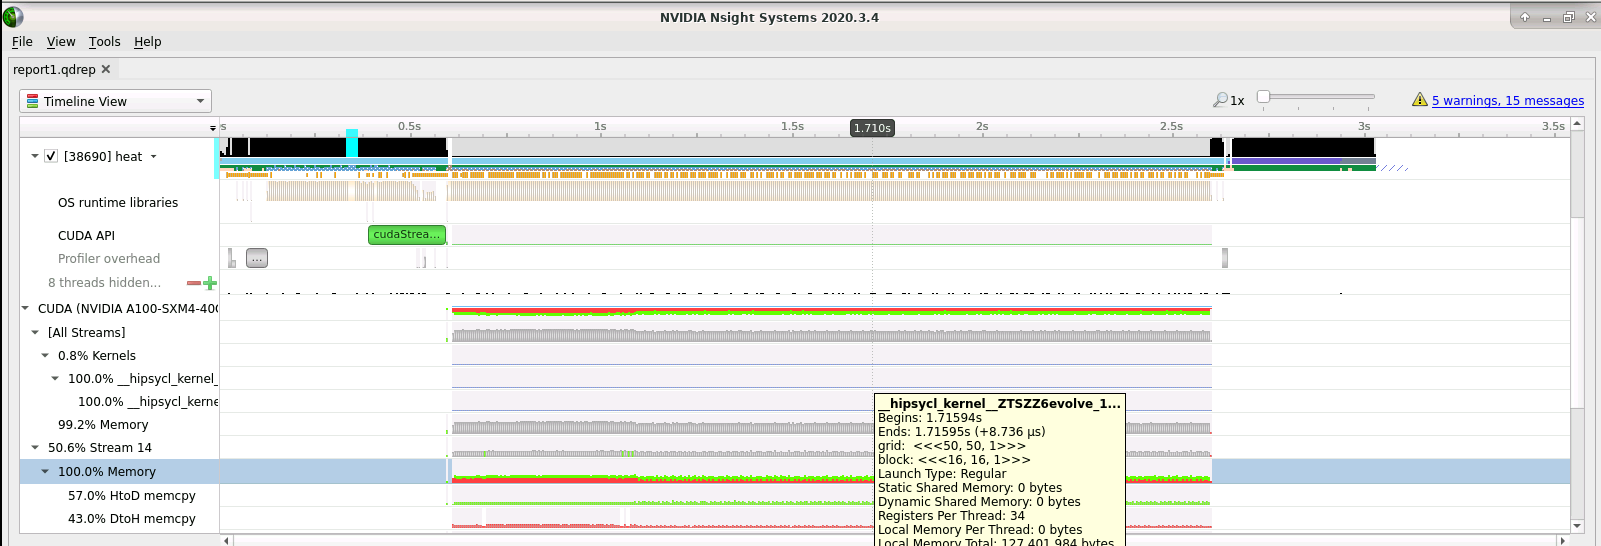
Double-click on the “CUDA (NVIDIA A100-SXM4-40GB)” tab to expand the timeline view of what’s happening on the GPU card. You will notice that we spend the overwhelming majority of the time in host-to-device and device-to-host memory copies. Where is this happening and how can we improve the situation? Hint: what happens when we call the destructor of buffer objects associated with host memory?
The evolve function is the culprit here. At every timestep we pass the
curr and prev data structures in:
void
evolve(queue &Q, field *curr, field *prev, double a, double dt)
and then we open a new scope to associate their data with SYCL buffers:
  {
    buffer<double, 2> buf_curr { curr->data.data(), range<2>(nx + 2, ny + 2) },
      buf_prev { prev->data.data(), range<2>(nx + 2, ny + 2) };

    Q.submit([&](handler &cgh) {
      auto acc_curr = accessor(buf_curr, cgh, read_write);
      auto acc_prev = accessor(buf_prev, cgh, read_only);

      cgh.parallel_for(range<2>(nx, ny), [=](id<2> id) {
        auto j = id[0] + 1;
        auto i = id[1] + 1;

        acc_curr[j][i] =
          acc_prev[j][i] +
          a * dt *
            ((acc_prev[j][i + 1] - 2.0 * acc_prev[j][i] + acc_prev[j][i - 1]) /
               dx2 +
             (acc_prev[j + 1][i] - 2.0 * acc_prev[j][i] + acc_prev[j - 1][i]) /
               dy2);
      });
This incurs a host-to-device copy, when declaring the buffers, and a device-to-host copy, when the buffers go out of scope. Both copies happen at every timestep and this is wasteful. we need two arrays to hold the heat field: one for the values at the previous timestep, one for the values at the current timestep. These arrays do not change size during execution and thus can be allocated on the device at the start and only copied back when needed for I/O purposes. A strategy to optimize this code would then be:
Create buffers to the current and previous heat field data outside the time-stepping loop.
Modify the
evolvefunction to acceptbuffer, instead offieldobjects.The
swap_fieldsfunction would have to be modified as well to accept buffers.
Keypoints
Footnotes